Process control and statistics
Q1
(a) (i) State 4 rules for identifying out-of-control signals in Control Charts
(ii) Distinguish between common cause variation and assignable cause variation,
describing sources of each from a manufacturing perspective.
(b) The following 10 measurements of length are recorded in time sequence order:
28m, 20m, 32m, 44m, 28m, 30m, 30m, 26m, 28m, and 34m
(i) Calculate the Mean
(ii) Calculate the Standard Deviation.
(iii) Calculate the Upper Control Limit and the Lower Control Limit
(iv) Draw the Control Chart with Limits
(v) Analyse your Control Chart – is the process in control?
Q2 Analyse the Individuals and Moving Range Chart that is pictured below. Note that the
Control Chart has been produced in Minitab with the rules switched off.
Answer the following questions:
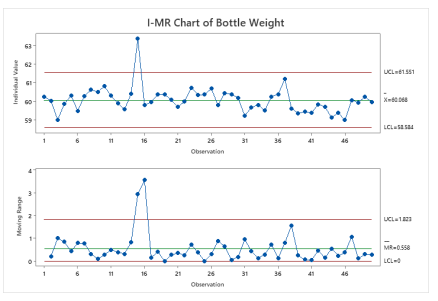
a) Explain whether the Bottle Weight process is in control or not in control.
b) What additional investigation of the data presented in the Control Charts could be
conducted in order to understand how the process is performing?
